Radiotherapy and
Oncology, 22 (1991) 180-189 © 1991 Elsevier Science Publishers B.V. Ail rights reserved.
0167-8140/91/$03.50
RADION 00894
Pierre
Scalliet1 , Jean-Marc Cosset2 and
Andre Wambersie3
1Department of Radiotherapy, AZ Middelheim, Lindendreef Antwero, Belgium,
2Department of Radiotherapy, Institut Gustave Roussy. France.
3Unite de Radiothérapie. neutron- et curiethérapie. Cliniques Universitaires
Saint Luc. Bruxelles. Belgium
(Received 2
January 1991, revision received 8 July 1991, accepted 5 August 1991)
However, more than simply calculating ADD from simulation charts, TPS have proven to be
valuable tools for dose distribution optimization, i.e. for the definition
Let us illustrate this with some situation where a normal structure, close to the tumor,
receives 50 % of the total dose (i.e. lies on the 50% isodose). In such a case, the
absorbed dose delivered to this structure is given in the same number of fractions as the
100 % dose delivered to the tumor. Each fraction is then only 50 % of the prescribed
fraction size (e.g. 1 vs. 2 Gy), and has a different biological effectiveness. Therefore,
the absorbed 50% dose (AD) needs to be translated into a biological equivalent dose (BED),
which takes into account the actual dose per fraction and the radiobiological
characteristics of the relevant tissue. This is of particular importance in daily clinical
applications since, as mentioned before, most of the maximal tolerance doses used in our
common practice are assumed to be delivered in fractions of 2 Gy.
From a mathematical point of view, the problem is simple. But the real question is the
validity of the biological concept involved. In the past, the NSD has been proposed for
the calculation of isoeffect doses [8]. The practice has soon proved its limitations,
especially in the calculation of dose equivalencies of treatments delivered with a number
of large fractions to late responding tissues. Attempts to replace the classical fraction
of 2 Gy by larger fractions (2.5 or 3.3 Gy) eventually led to catastrophic normal tissue
late damages [5]. The NSD should undoubtedly no longer be used.
In the past 10 years, the linear-quadratic (LQ) model has gained general acceptance as a
comprehensive and biologically more founded isoeffect model, supported by a large number
of clinical and radiobiological publications (extensively reviewed by Thames and Hendry
[24]).
This paper deals with the use of the LQ isoeffect model in the interpretation of ADD, and
more particularly in the calculation of isoeffect (or biologically equivalent) doses, in
normal tissues receiving a dose different to the 100% prescribed dose.
Example
3 is based on an other CT cross-section through the thorax of a 64-year-old man treated
for a non-small-cell bronchial carcinoma of the right lung (level Th 6).
Physical
parameters
This
finding has logically lead to the definition of new isoeffect relationships, the most
recent of which being based on the LQ ceil survival model [4,15]. This model is at present
considered to be the most reliable one, mainly for two reasons: its ability to describe
adequately the variation of isoeffect dose with the fraction size within a dose range of
interest to the clinic (1-1.5 to 9-10 Gy), and its great simplicity of use in the daily
radiotherapy routine. Extensive discussions concerning the relevance of this formalism
have been published, to which the reader can refer for a basic understanding of the
mathematical equations (see refs. [9,24]).
It
has been shown that the influence of fractionation on a variety of normal tissues can be
described on the basis of a simple formula relating the radiation effect (E) to the
total dose (D) delivered in (n) fractions of size (d): the LQ dose
effect relationship:
From
this equation, the ratio a
/b
is derived as an essential parameter for the description of fractionation effects. a
and b
are constants with specific values depending on the measured effect (i.e. the tissue
involved) and on the irradiation conditions (radiation quality, dose rate...).
Calculation
of isoeffect dose equivalencies when altering the fraction size can be done very simply,
by using the formula developed by Withers [29]:
![]() (see Appendix)
(see Appendix)
Where
D is a reference total dose delivered at a given fraction size d and D' the
unknown total dose delivered at a new fraction size d'. This can be illustrated
with a short example. Let us consider a classical treatment of 60 Gy (D) in 30
fractions of size 2 Gy (d), to be replaced by a new schedule with 3 Gy per fraction
(d'). To find the new total dose D', isoeffective to 60 Gy in 30 fractions,
we may write:
![]()
To
solve the equation, a choice of an a
/b
value must be made. We already know, from radiobiological as well as from clinical data
(recently reviewed in [9] and [25]), that normal tissue reactions are broadly distributed
into two categories: the early reacting tissues, characterized by low fractionation
sensitivity, and the late reacting tissues with large fractionation sensitivity. An a
/b
value of 10 Gy is usually attributed to the former, and a value of 2 to 3 Gy to the
latter. It has been shown elsewhere [1,9] that these two values are sufficiently
representative of the two groups of tissue reactions and that the error is small when
one uses average a
/b
value in place of the exact one derived from experimental work (in fact, each tissue seems
to have its own a
/b;
see further). We may thus carry on with our formula, and calculate for both types of
tissue reactions:
![]() for
a /b
= 2Gy
for
a /b
= 2Gy
![]() for
a /b
= 10Gy
for
a /b
= 10Gy
which
gives D' = 48 Gy and D' = 55.4
Gy,
respectively. Thus, according to Wither's LQ isoeffect equation, 60 Gy in 30 fractions is
equivalent to 48 Gy in 16 fractions (48 divided by 3 Gy, the new dose per fraction), for a
tissue with a
/b
= 2 Gy; for a
/b
= 10 Gy, the equivalent to 60 Gy is 55.4 Gy, which corresponds to something comprised
between 18 and 19 fractions of 3 Gy (exactly 18.4, but one has to choose...).
It
is now clear that, apart the fraction size, the all important parameter is the ratio a
/b.
On the basis of these considerations, it becomes clear that fraction size alterations, for
doses of interest in radiation therapy, will result in a larger tolerance dose variations
in late than in early reacting tissues. Indeed, in our example, late reacting tissues need
a dose reduction of 20% whereas early reacting ones need only 8% of dose reduction when
increasing the dose per fraction from 2 to 3 Gy.
This equation has
been used throughout the following examples for the calculation of BED from ADD provided
by the TPS. Before starting with the examples, a last remark seems necessary: ample
evidence exists that doses per fraction larger than 2 Gy can lead to severe clinical
problems in late reacting tissues if the proper dose reduction factor is not applied. On
the other hand, a reduction of the dose per fraction below 2 Gy is expected to allow for
an increase in total dose, but this is far less demonstrated in the clinic than it has
been in experimental radiobiology. More clinical data are needed before extrapolating with
full confidence from radiobiology to radiotherapy. Some answers have been found in the
Institut Gustave Roussy experience of lung irradiation in Hodgkin's tumors (unpublished
results). Between January 1988 and December 1989, 25 patients have been irradiated with
lung attenuator blocks reducing the daily dose from 2 to 1 Gy. Twenty Gy were delivered to
the lungs in 4 weeks with this technique. So far, no toxicity could be detected, either
symptomatically or radiologically. Functional evaluation was carried out in 7 patients,
with all 7 tests within the normal range for age and sex. This suggests that the reduction
in dose per fraction actually protects lungs and by extension other late reacting tissues
as amply suggested by experimental irradiation in animal models.
Figure
1 illustrates the ADD in a transversal section of the thorax (level Th 8), for a
theoretical posterior mediastinal tumor. Four perpendicular isocentric fields deliver an
homogenous dose throughout the target volume, with an acceptable dose to the surrounding
normal structures (heart, spinal cord and lungs). Fifty-four Gy are prescribed on the 100%
isodose, and, according to ICRU 29 specified at the intersection of the beam axes. The
treatment is planned in 27 daily fractions of 2 Gy. The four fields are to be treated on
each day, 5 days per week.
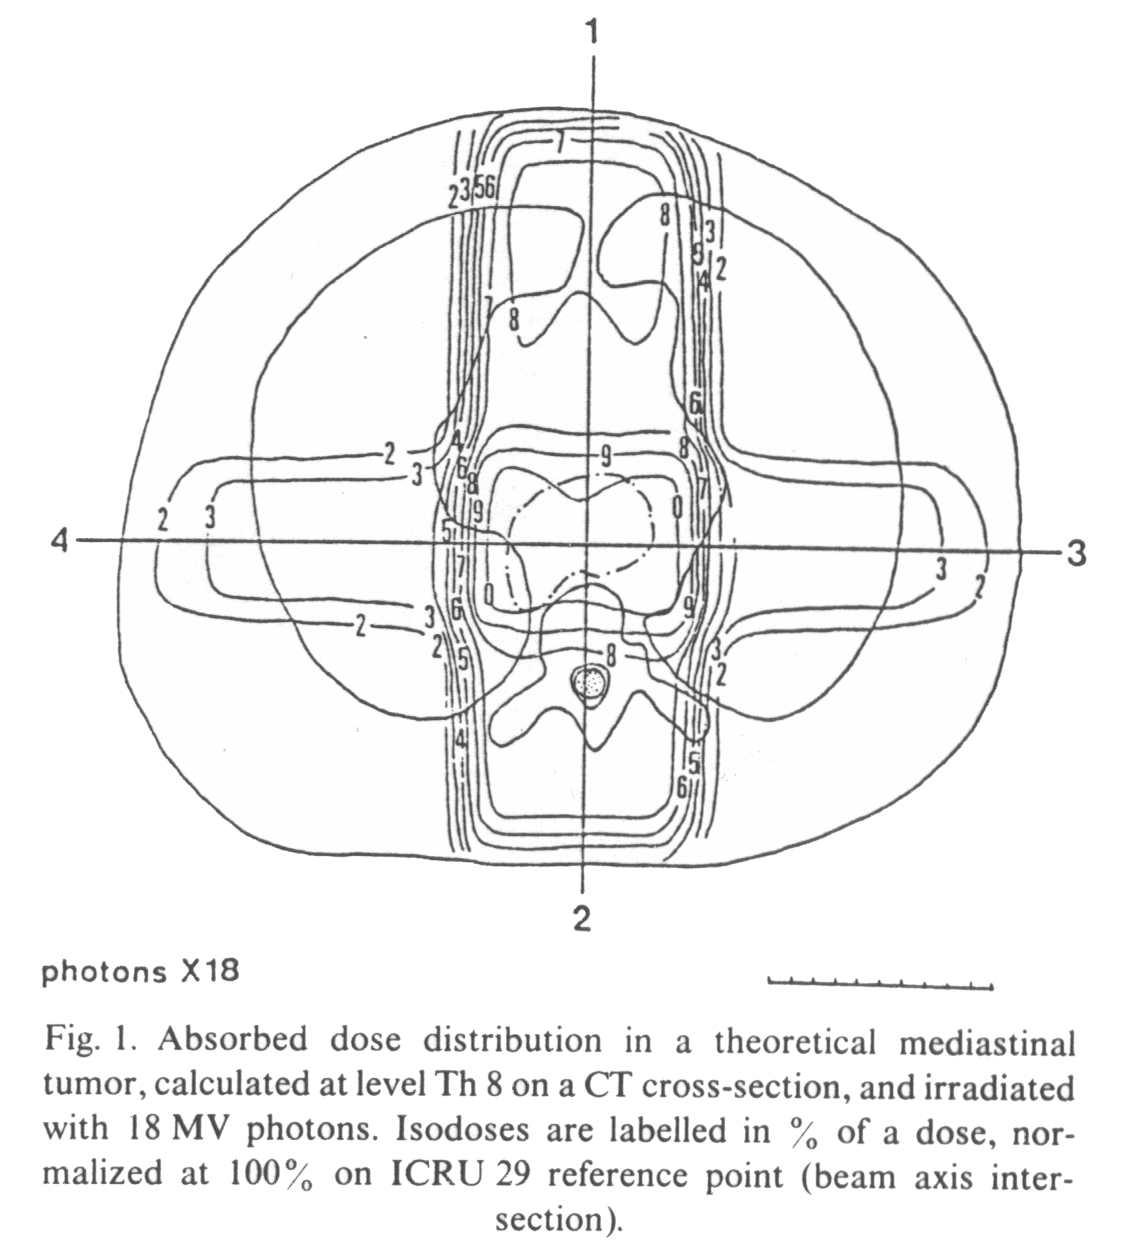
The spinal cord
receives 75% of the dose (40.5 Gy) in 27 fractions, i.e. with doses per fraction of 1.5
Gy. Part of the lungs is irradiated by the lateral fields, receiving 30-40% of the dose,
i.e. 16.2-21.6 Gy by 27
fractions of 0.6-0.8 Gy. The heart receives on average 80% of the total dose, i.e. 43.2
Gy by fractions of 1.6 Gy.
Assuming a common a
/b value of 2 Gy for
these (late reacting) tissues, the dose equivalent to a treatment delivered at 2 Gy per
fraction can be calculated. The results are given in Table I : 35.4 Gy BED vs. 40.5 Gy AD for spinal cord, 10.5-15.1
Gy BED vs.
16.2-21.6 Gy AD for lungs and 38.8 Gy BED vs. 43.2 Gy
AD for the heart, respectively.
Table
I |
||||||
Biological equivalent
doses for different normal tissues irradiated along with the tumor (denoted here target).
The a/b is not defined for the target as, by definition, no correction is to be done at
the 100% level dose. |
||||||
|
Absorbed dose (Gy) |
Isodose (%) |
a/b (Gy) |
Dose / fraction (Gy) |
Equivalent dose for 2
Gy/fraction |
Equivalent isodose for 2
Gy/fraction |
Target |
54 |
100 |
- |
2 |
54 |
100 |
|
|
|
|
|
|
|
Spinal cord |
40.5 |
75 |
2 |
35.4 |
35.4 |
65 |
Heart |
43.2 |
80 |
2 |
1.6 |
38.8 |
71 |
Lungs |
21.6 |
40 |
2 |
0.8 |
15.1 |
28 |
|
16.2 |
30 |
2 |
0.6 |
10.5 |
19 |
|
|
|
|
|
|
|
Skin |
37.8 |
70 |
10 |
1.4 |
35.9 |
66 |
|
32.4 |
60 |
10 |
1.2 |
30.2 |
56 |
|
27 |
50 |
10 |
1 |
24.7 |
46 |
Lung:
in
a recent publication, Van Rongen et al. [27] quoted a value of 2.3 Gy for late fibrosis of
the rat lung (as assessed by measurements of hydroxyproline content of the lung
parenchyme 18 months after irradiation). With this value, the BEDs become 10.9 and 15.6
Gy, respectively.
Spinal
cord: van
der Schueren et al. [26] derived an a
/b
value of 1.7 Gy for the rat spinal cord (measured from hindleg paralysis induction after
cervical cord irradiation), which results in the present situation in a BED of 35 Gy.
According
to these calculations, it would be theoretically possible to increase the tumor dose
without exceeding the tolerance of normal tissues. If, for example, 60 Gy were delivered
to the tumor, the AD to the spinal cord would be closer to the limit that can be safely
reached. However, the BED would still remain below the common accepted limit for the
irradiation of a large segment of the myelum (something around 45 Gy with 2 Gy per
fraction).
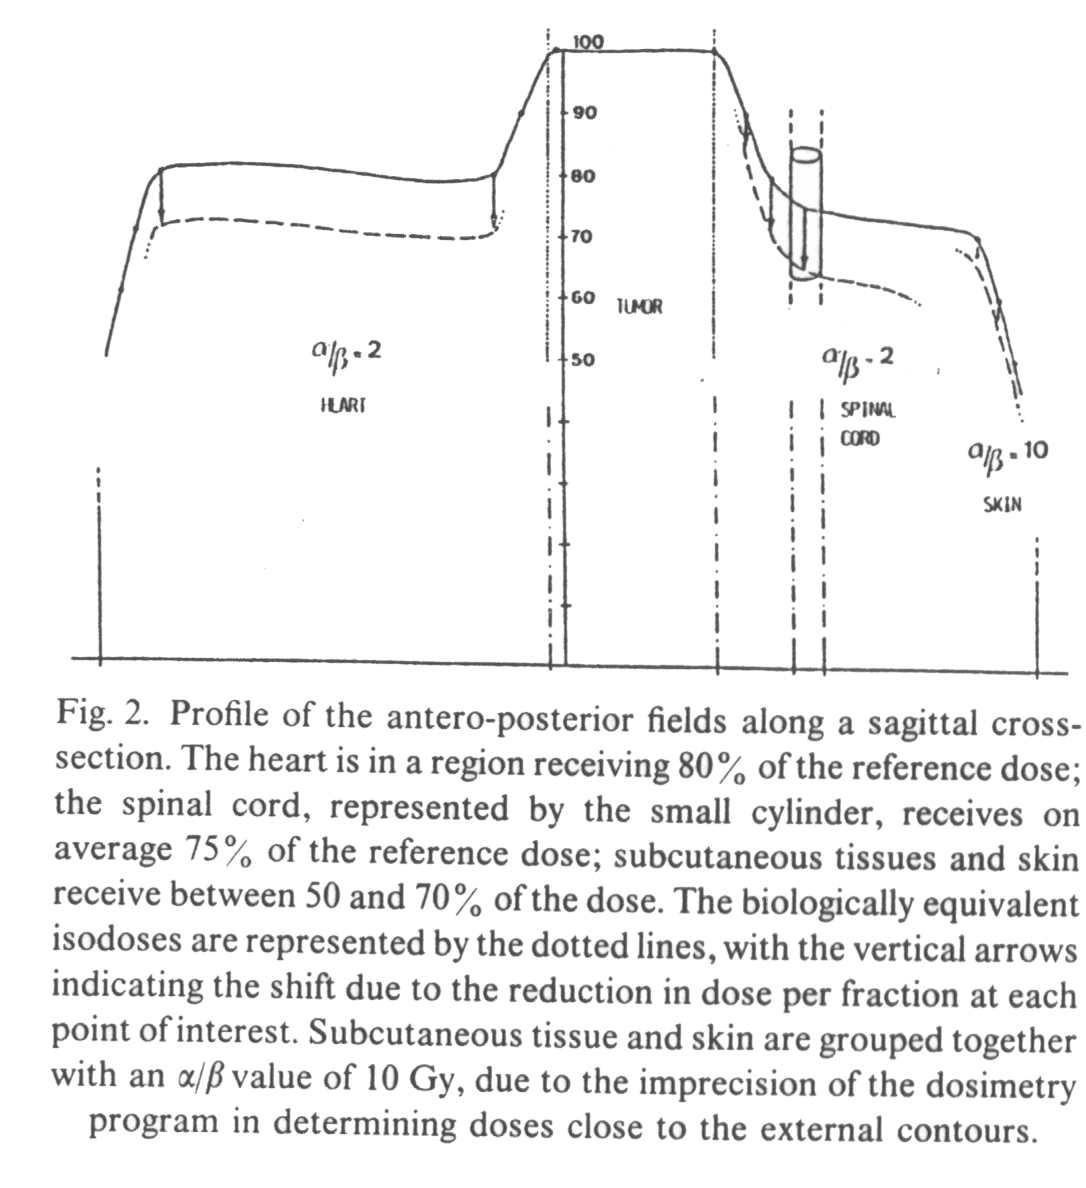
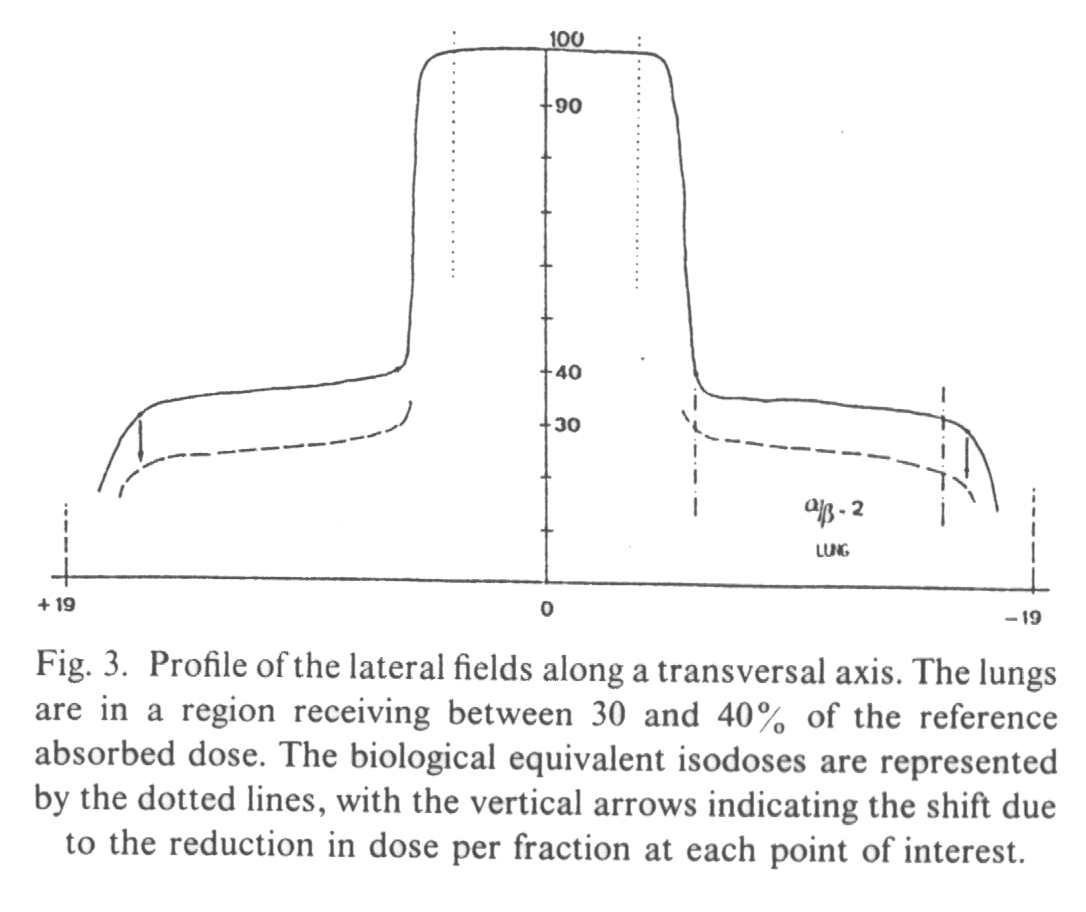
A
profile of the anterio-posterior (AP) fields (Fig. 2) and of the lateral fields (Fig. 3)
demonstrates that the biological penumbra is more favorable than the simple physical
penumbra, in late responding tissues receiving less than the (100%) tumor dose. The 90%
isodose becomes the 85% biological isodose, the 80% becomes the 71%, the 75% becomes the
65%, the 40% becomes the 28% and the 30% becomes the 19%.
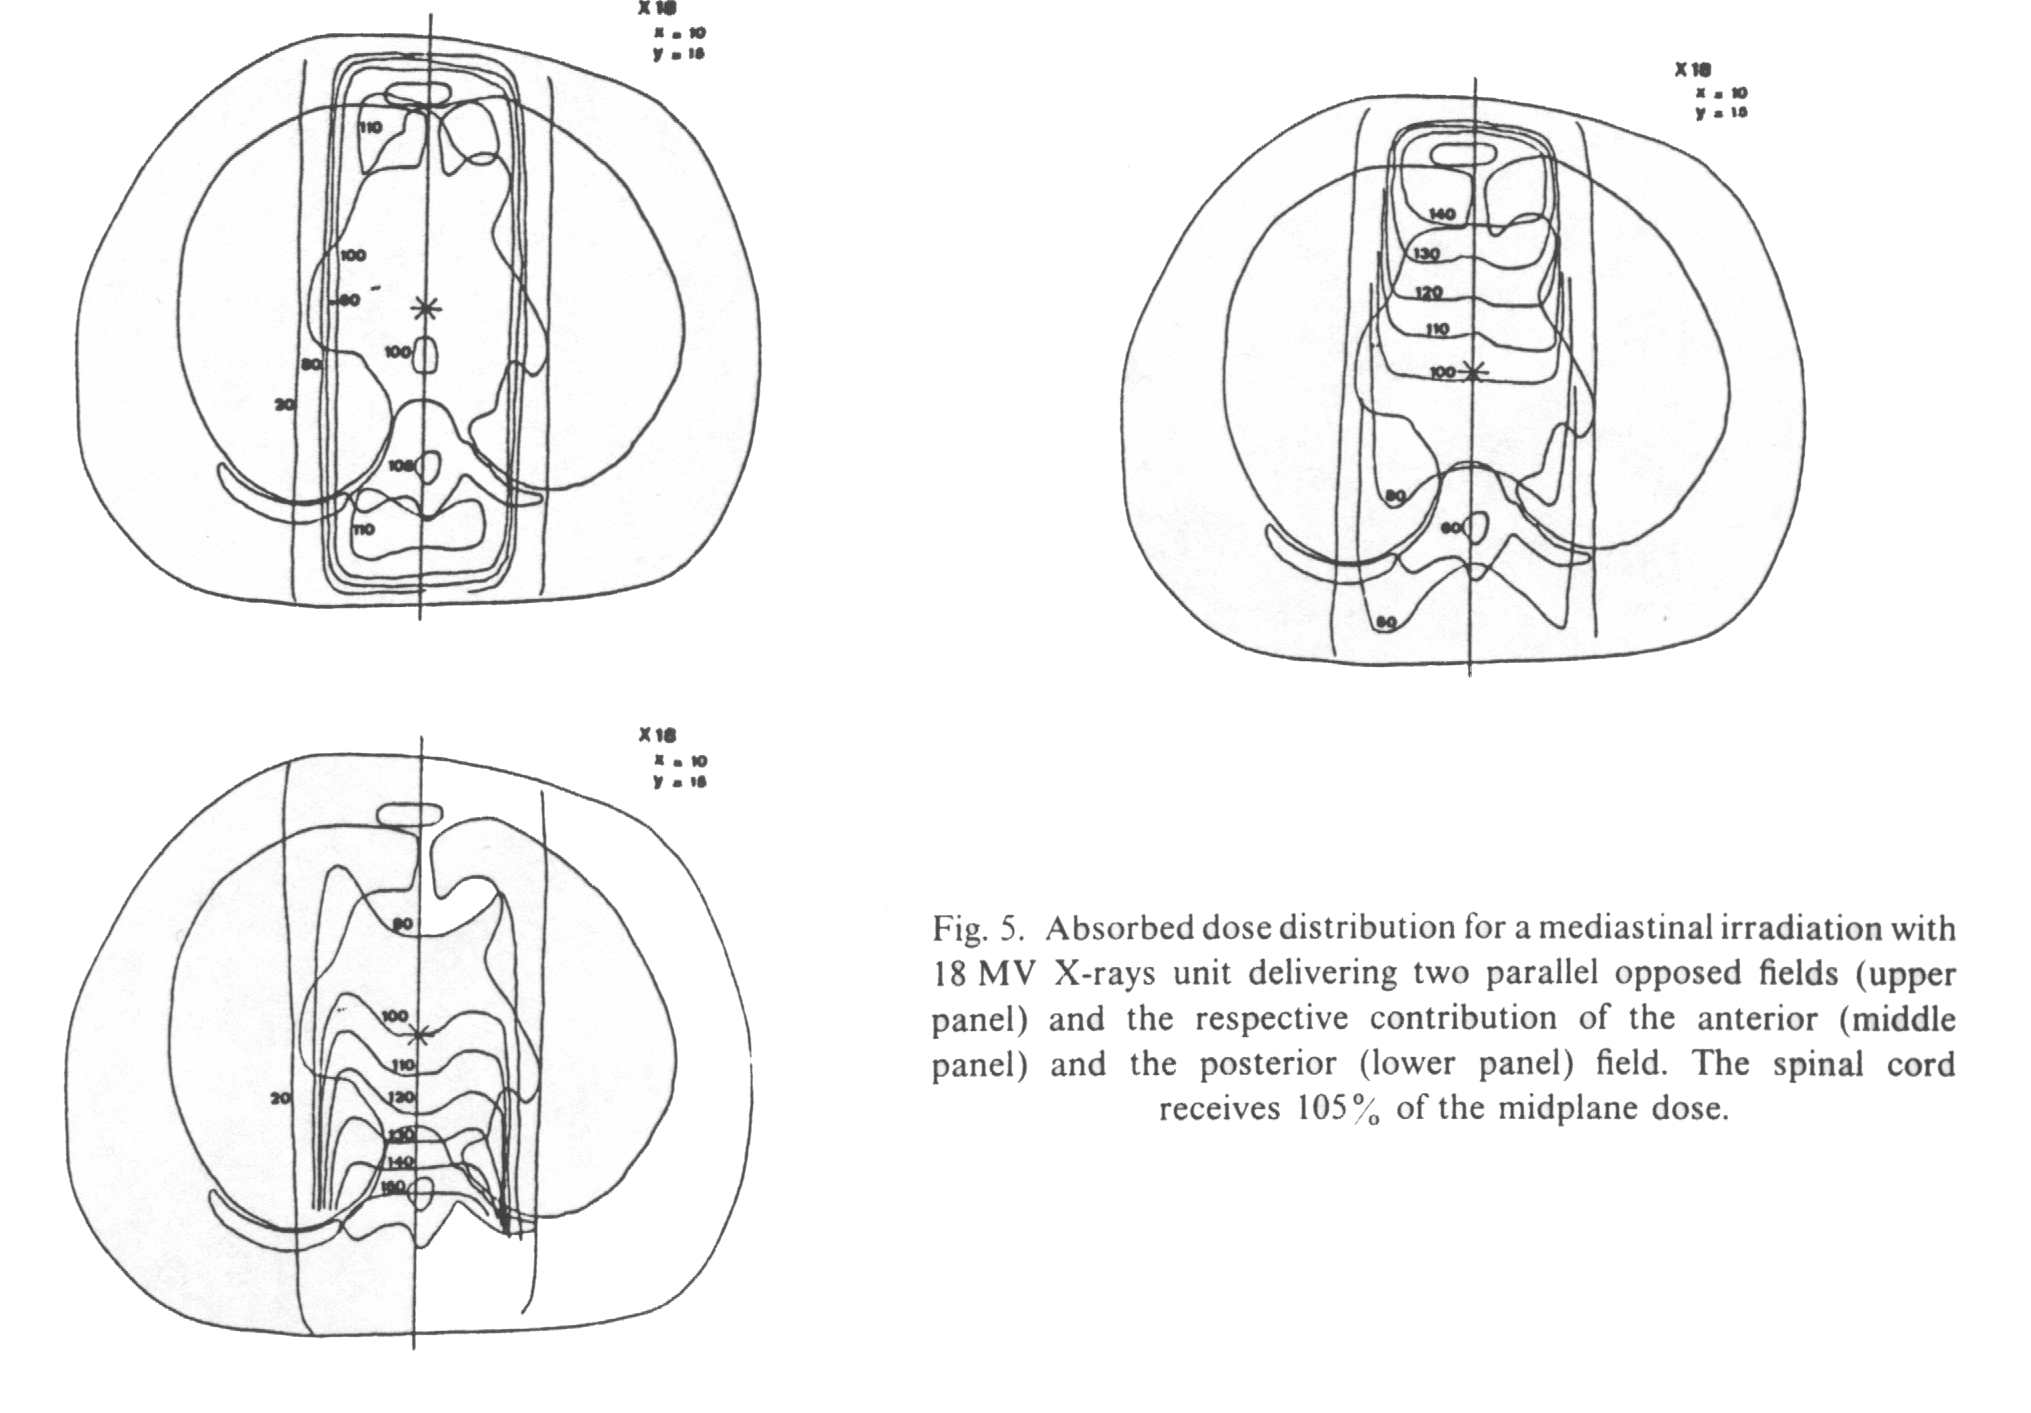
The second example is
based on dose distribution from two parallel opposed fields in the same thoracic
cross-9Mb) section where the tumor contour has been omitted. Calculations are done with
two different photon energies, giving the distribution of dose for an anterior, a
posterior and two parallel opposed fields, either with cobalt-60 (SSD 80 cm) or with 18 MV
photons. Two situations are envisaged: (1) the two fields are irradiated daily and (2) the
anterior and the posterior fields are
alternatively treated every other day*. Figure 4 shows the different sets of isodoses for
cobalt-60 and Fig. 5 for 18 MV X-rays.

If
anterior and posterior fields are equally weighted, it is shown that for an AD of 36 Gy at
midplane the spinal cord receives
37.8 Gy (105%) with 18 MV photons and 43.2 Gy (120%) with cobalt-60 gamma rays. The
superiority of high energy photons speaks for itself, but even with cobalt-60 the dose to
the spinal cord seems to remain within tolerance limits.
Cobalt-60. The 36 Gy at midplane are delivered in 18
fractions of 2 Gy, 9 by the anterior and 9 by the posterior field. When irradiating the
anterior field, the spinal cord receives 55% of the midplane dose, i.e. 9.9 Gy with a dose
per fraction of 1.1 Gy. For the posterior field, the spinal cord receives 182% of the
midplane dose, i.e. 33.3 Gy with a fraction size of 3.7 Gy. The total absorbed dose to the
spinal cord, taking into account the contribution of both the anterior and the posterior
field, is 9.9 + 33.3 = 43.2 Gy (Table II).
Table
II |
||||||
Biological equivalent doses
at the spinal cord for two parallel opposed cobalt-60 fields. |
||||||
|
Isodose Spinal cord (%) |
Absorbed dose (Gy) |
Dose / fraction (Gy) |
Biological equivalent dose
(Gy) |
Biological equivalent
isodose (%) |
|
Two field per day |
120 |
43.2 |
2.4 |
47.5 |
132 |
|
|
|
|
|
|
|
|
Alternative |
Anterior |
55 |
9.9 |
1.1 |
7.67 |
|
Fields |
Posterior |
182 |
33.3 |
3.7 |
47.4 |
|
|
total |
120 |
43.2 |
|
55.07 |
154 |
If the two fields are
treated on each day, we can reasonably assume that no significant repair takes place
during the few minutes necessary for the set-up of the second field after the first has
been irradiated. One can consider that the two fields are treated simultaneously with dose
per fraction to the spinal cord of :
The situation will be even worse with a
cobalt-60 unit working at shorter SSD since the depth dose distribution is even poorer.
Let us consider an old telecobalt unit
with 50 cm SSD (not shown). In our present example, the spinal cord would lie on the 122%
isodose, with a total AD of 44.1 Gy. Nine Gy would be given by the anterior field (50%
isodose), and 35.1 Gy by the posterior field (195%). The BED would be 49 Gy if both fields
were to be treated on each day (hot schedule!), and reach 58.45 Gy for alternative
fields (totally indefensible if such a case were brought before the courts...)
Table
III |
||||||
Biological equivalent doses
at the spinal cord for two parallel opposed 18 Mv photon fields. |
||||||
|
Isodose Spinal cord (%) |
Absorbed dose (Gy) |
Dose / fraction (Gy) |
Biological equivalent dose
(Gy) |
Biological equivalent
isodose (%) |
|
Two field per day |
105 |
37.8 |
2.1 |
37.8 |
107 |
|
|
|
|
|
|
|
|
Alternative |
Anterior |
60 |
10.2 |
1.2 |
8.6 |
|
Fields |
Posterior |
150 |
27 |
3 |
33.7 |
|
|
total |
105 |
37.8 |
|
42.5 |
118 |
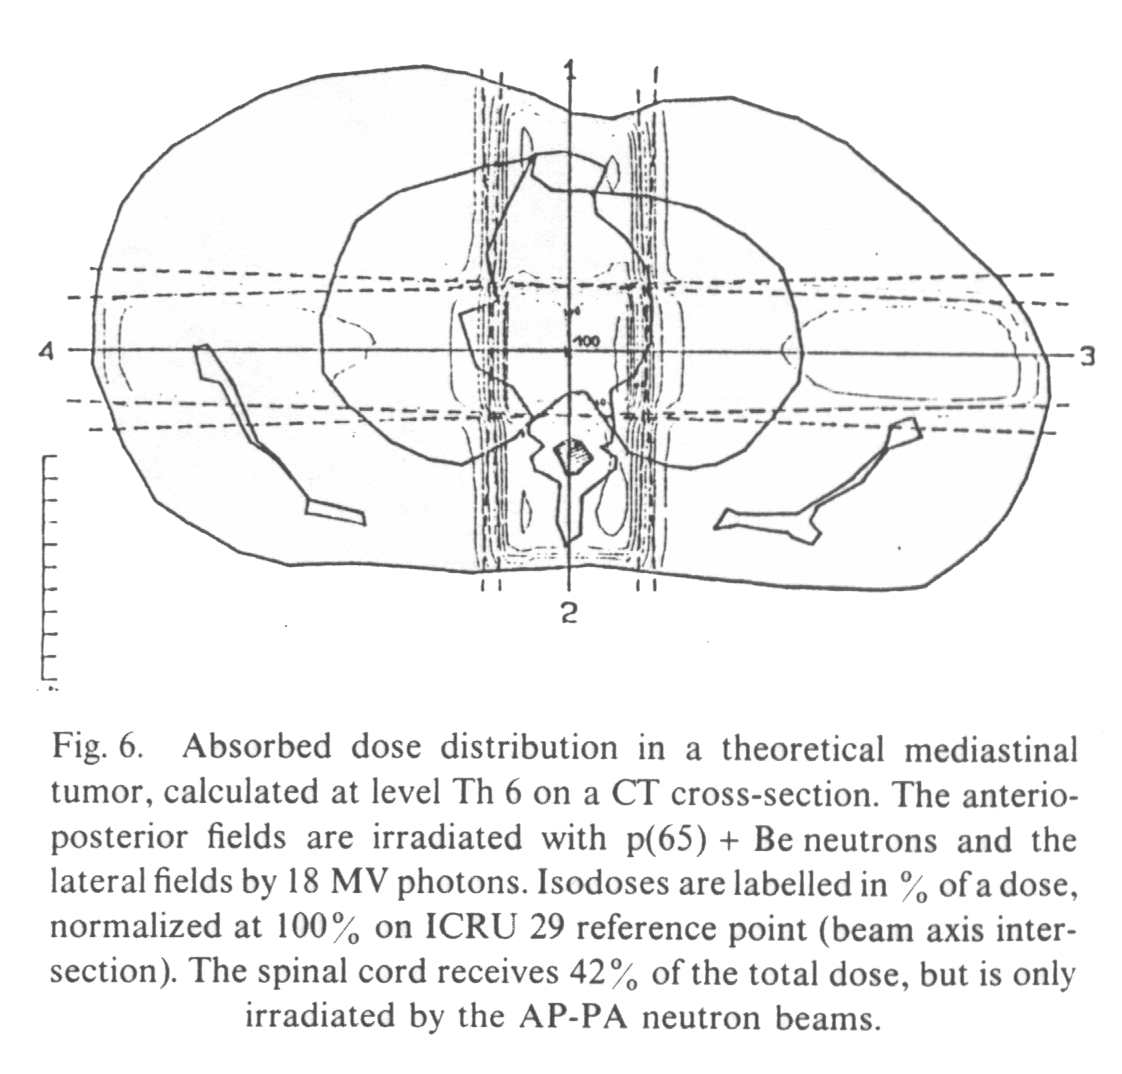
Figure 4 shows the absorbed dose distribution in an other CT plane (level Th 6), using a four field technique associating two AP parallel opposed neutron fields and two lateral parallel opposed 18 MV photon fields. This kind of beam arrangement is used in some neutron therapy centers in the treatment of gynecologic high stage pelvic tumors or prostatic adenocarcinoma and is occasionally proposed for bulky lung tumors (the case discussed here).
Neutron
beams take their potential interest from their particular biological properties, and share
these properties with all other high LET radiations. The important point here is that
fractionation sensitivity is dramatically reduced with neutrons, as compared to gamma and
X-rays. Indeed, data of the literature indicate almost uniformly high a
/b
values for normal tissues, i.e. higher than those quoted for low LET radiations. For
instance, an a
/b
ratio of 23 Gy for lip mucosa [20] has been reported in biological murine systems. Studies
in skin, kidney, colo-rectum and lung [14,17,21,22] have all demonstrated an approximately
10-fold increase in the a
/b
ratio for 3 MeV neutrons relative to X-rays. For fast neutrons of higher energy, such as
those used in neutron therapy, a
/b
ratio are somewhat smaller, but still well above those determined from low-LET
irradiations.
Therefore, since tissues characterized by a
/b ratios of 10 Gy and more are
little sensitive to fraction size alterations below 2.5-2 Gy, the BED calculated in our
example with the LQ model are similar to the AD, at least for the AP neutron fields. In
fact, the maximum increase in total dose, for a change in dose per fraction of 2 to i Gy,
is only 3%, which falls in the range of uncertainty of neutron dosimetry. For the lateral
photon fields, the situation is comparable to the one described in example 1.
Nevertheless,
when planning a neutron treatment, practical reasons call for a kind of single average RBE
value (sometimes called the clinical RBE, or the clinical neutron potency factor, CNPF)
allowing for the calculation of "photon equivalent dose". This is a less than
satisfactory solution, but such a simplification seems unavoidable in the clinical
practice since, after all, a dose has to be prescribed. The limits of the concept of a
photon equivalent dose must, however, be kept in mind, in order to avoid overdosage of
sensitive normal structures.
If
no correction is needed for alterations in dose per fraction, it is essential to take into
account the variation in RBE. Indeed, different RBEs have been reported for normal tissues
when comparing fast neutrons to low LET radiations. These RBE values vary by a factor of
4, suggesting that the severity of different types of morbidity is likely to be different
after neutron than after conventional radiotherapy (reviewed in ref. [3]). It is also a
general (though not universal) finding that neutron RBEs for late effects are greater than
for acute toxicity. This is connected with the use of fractionated irradiations in photon
radiotherapy, which reduces the severity of late reactions.
In the present
example, the neutron (n + y) dose has been converted in a photon equivalent dose
using a clinical RBE of 2.8 Gy, determined from mouse jejunal crypt ceIl experiments. The
rationale for this choice has been discussed elsewhere [11], but an important point is
that this RBE refers to acute reactions. As usual, the isodoses are labeled in % of a
total photon (lateral fields) and photon equivalent dose (AP fields). In the present case,
the dose-limiting normal tissue is again the spinal cord. It can be seen from Fig. 6 that
the spinal cord receives 75% of the total dose, i.e. 37.5 photonequivalent Gy for a dose
of 50 Gy prescribed at the intersection of the beam axes. On the other hand, the
contribution of the photon lateral fields is only 2%, the spinal cord being irradiated
only by the AP neutron fields.
If
the clinical RBE of 2.8 has proven to be acceptable in the practice for most normal
tissues (soft tissues, with an experience of now over 1200 patients in Louvain-la-Neuve,
UCL University), the RBE of the spinal cord, and more generally of the whole CNS, is much
higher, and possibly as high as 5 [12]. It is thus essential to convert the photon
equivalent dose calculated with RBE = 2.8 in a photon equivalent dose calculated with RBE
= 5, i.e.:
An
additional parameter also needs to be considered, which is the gamma component of the
neutron beam. It is, however, of unequal importance among the different neutron therapy
facilities, as it depends on a number of factors (type and energy of particle
accelerated, type 0f target, collimator, etc). We will not discuss it here, since it can
be easily solved from the examples above. It is sufficient to know what is the gamma
proportion of the (n + y) dose and to carry out the calculations separately for
each component*.
(2)
No time factor was involved in this short overview, since we compared only different
levels of dose per fraction within a single treatment, i.e. delivered by definition in the
same total time. If the Wither's formula is to be used for comparison between different
treatments, distributed among different total treatment times, a time factor must be
included when relevant (early reacting tissues, or slow repair in late reacting tissue).
Time factors have recently been discussed by Fowler, and the interested reader can best
refer to his last paper on this subject [10].
(3)
All these calculations have been done assuming a daily fractionation schedule, i.e. with
intervals of 24 h between consecutive fractions. The formula is not valid for concentrated
schedules where rep air may be incomplete between consecutive fractions (where
unrepaired sub lethal damage from a given fraction can interact with the following
fraction), in which case the Incomplete Repair model of H. Thames [23] is probably the
most appropriate approach which has been proposed, 50 far. (4) It is tempting to modify
the presently available computer planning systems, by adding a routine calculating
automatically the biological equivalents, as recently proposed by Beck Bornholdt et al.
[2]. In our opinion, this should be envisaged with caution, since any misuse can lead to
clinical disasters if, for example, wrong biological parameters are entered in the system.
On the other hand, manual calculation, as presented here, makes one think about the
biological meaning of any given dose and can be carried out on a small pocketcalculator.
It is our opinion that a routine use of these corrections by the radiotherapist implies a
good understanding of the biological concept involved, as an important part of the
general knowledge required for the practice of radiation oncology.
2 Beck-Bornholdt, H. P., Schmidt, R., Schwarz, R. C. and Hubener, K. H. Biological isoeffect distribution: consideration of the influence of dose per fraction and overall treatment time. A possible tool in future treatment planning. Radiother. Oncol., in press, 1991.
3 Bewley, D. K. The physics and radiobiology of fast neutron beams. Adam Hilger eds. Bristol & New York, 1989.
4 Chadwick, K. H. and Leenhouts, H. P. A molecular theory of cell survival. Phys. Med. Biol. 18: 78-87, 1973.
5 Cosset, J. M., Henry-Amar, M., Girinski, T., Malaise, E., Dupouy, N. and Dutreix, J. Late toxicity of radiotherapy in Hodgkin's disease. The role of fraction size. Acta Oncol. 27: 123-146, 1988.
6 Coutard, H. Roentgentherapy of epitheliomas of the tonsillar region, hypopharynx and larynx from 1920 to 1926. Am. J. Roentgol. 28:313-331, 1932.
7 Dutreix, J., Wambersie, A. and Bouhnik, C. Cellular recovery in human skin reactions: application to dose fraction number overall time relationship in radiotherapy. Eur. J. Cancer 9: 159-167, 1973.
8 Ellis, F. Fractionation in radiotherapy. In: Modem Trends in Radiotherapy, Vol. 1. Editors: T. J. Deeley and C. A. P. Wood. Buterworth, London, 1967.
9 Fowler, J. F. The linear-quadratic formula and progress in fractionated radiotherapy. Br. J. Radiol. 62: 679-694, 1989.
10 Fowjer, i F. How worthwile are short schedules in radiotherapy?: a series ofexploratory calculations. Radiother. Oncol. 18:165-182, 1990.
11 Gueulette, J. Thesis. Universite Paul Sabatier de Toulouse, 1978.
12 Hornsey, S. RBE for lung and cord. Int. J. Radiat. Oncol. Biol. Phys. 8: 2099-2102, 1982.
13 ICRU Report 29. Dose specification for reporting external beam therapy with photons and electrons. Washington, 1978.
14 Joiner, M. C., Maughan, R. L., Fowler, J. F. and Denekamp, J. The RBE for mouse skin irradiated with 3 MeV neutrons: single and fractionated doses. Radiat. Res. 95:130-141, 1983. 15 Kellerer, A. M. and Rossi, H. H. The theory of dual radiation action. Curr. Top. Radiat. Res. Q. 8: 85-158, 1972.
16 Lauk, S., Ruth, S. and Trott, K.-R. The effect of fractionation on radiation-induced heart disease in rats. Radiother. Oncol. 8: 363-368, 1987.
17 Parkins, C. S., Fowler, J. F., Maughan, R. L. and Roper, M. J. Repair in mouse lung for up to 20 fractions of X-rays or neutrons. Br. J. Radiol. 58: 225-241, 1985.
18 Regaud, C. and Ferroux, R. Discordance des effets des rayons X, d'une part dans le testicule, par le fractionnement de la dose. C. R. Soc. Biol. 97: 431, 1927.
19 Rubin, P. Law and Order of radiation sensitivity. In: Front. Radiat. Ther. Oncol., Vol. 23, pp. 7-40. Editors: J. M. Vaeth and J. L. Meyer. Karger, Basel, 1989.
20 Scalliet, P. Investigation of repalr characteristics in early and late responding tissues. Comparison of fractionated and low dose rate experiments. Thesis, University of Leuven, in press, 1991.
21 Stewart, F. A., Soranson, J. A., Maughan, R., Alpen, E. L., Williams, M. V. and Denekamp, J. The RBE for renal damage alter irradiation with 3 MeV neutrons. Br. J. Radiol. 57: 1009-1021, 1984.
22 Terry, N. H. A. and Denekamp, J. RBE values and repair characteristics for colo-rectal injury alter cesiurn- 137 gamma-ray and neutron irradiation. Il. fractionation up to 10 doses. Br. J. Radiol. 57: 617-629, 1984.
23 Thames, H. D. An incomplete repair model for survival after fractionated and continuous irradiation. Int. J. Radiat. Biol. 47: 319-339, 1985.
24 Thames, H. D. and Hendry, J. H. Fractionation in Radiotherapy. Taylor & Francîs London - New York - Philadelphia, 1987.
25 Thames, H. D., Bentzen, S. M., Turesson, I., Overgaard, M. and van den Bogaert, W. Time-dose factors in radiotherapy: a review of the human data. Radiother. Oncol. 19: 219-236, 1990.
26 Van der Schueren, E., Landuyt, W., Ang, K. K. and Van der Kogel, A. J. From 2 to 1 Gy per fraction: sparing effect in rat spinal cord. Int. J. Radiat. Oncol. Biol. Phys. 14: 297-300, 1988.
27 Van Rongen, E., Madhuizen, H. T., Tan, C. H. T., Durham, S. K. and Gijbels, M. J. J. Early and late effects of fractionated irradiation and the kinetics of repair in rat lung. Radiother. Oncol. 17: 323-337, 1990.
28 Vynckier, S., Pihet, P., Flemal, J. M., Meulders, J. P. and Wambersie, A. Improvement of a p(65) + Be neutron beam for therapy at Cyclone, Louvain-la-Neuve. Phys. Mcd. Biol. 28: 685-691, 1983.
29 Withers, H. R., Thames, H. D. and Peters, L. J. A new isoeffect curve for change in dose per fraction. Radiother. Oncol. I: 187-191, 1983.
Withers
[29] calculated the isoeffect formula as follows:
We
already known that the relationship between any biological effect E and the
radiation dose D can be described by the LQ model:
E
= aD
+ bD2
If
the dose D is delivered in n fractions of size d, the formula becomes
E
= a
(nd) + b
(nd)2, with
D = nd.
If
we try to find out a new schedule, with a new dose per fraction d', equivalent to a
known reference schedule (i.e. isoeffective with this reference treatment) delivered in n
fractions of size d, we may write:
E = a
(nd') + b
(nd' )2
is equivalent
to E = a
(nd) + b
(nd)2,
therefore,
since the effect E is intended to be the same,
a
(nd) + b
(nd)2 = a
(nd') + b
(nd' )2
This
formula can be very simply converted, into the one published by Withers:
![]()